Configuring Pivot Tables
Overview
Pivot tables are powerful tools for exploring data dynamically, allowing you to uncover hidden trends and patterns. With InsightsIQ, you can configure and customize Pivot Tables to manipulate data efficiently and gain actionable insights.
Getting Started
Before configuring a Pivot Table, ensure you have:
- A dataset with well-structured data for analysis
- A clear goal for your analysis
- Understanding of data relationships
Business Value
- Summarize and analyze large datasets
- Rearrange data to explore relationships
- Compare metrics across dimensions
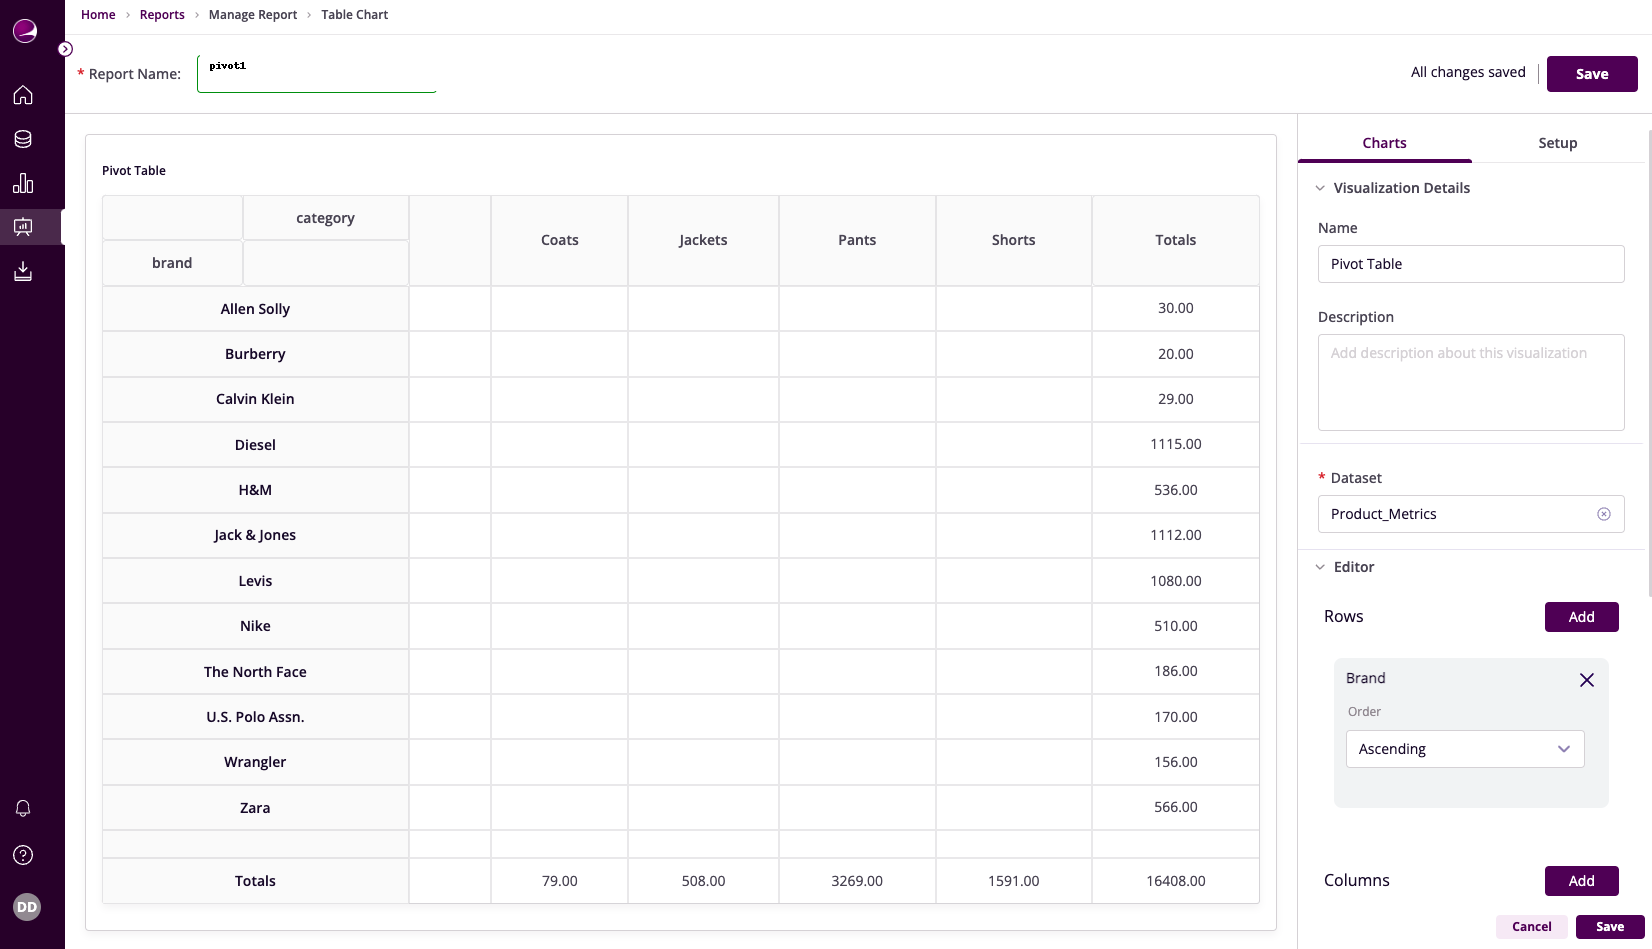
Table Configuration
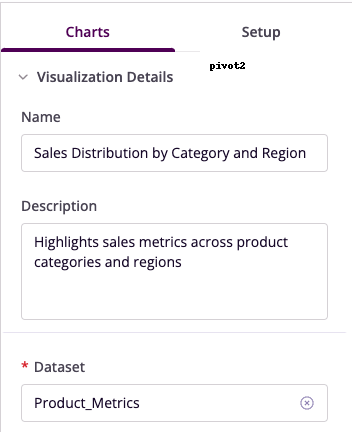
Basic Configuration
- Name: Provide a descriptive title
- Description: Add context about purpose
- Dataset: Select relevant dataset
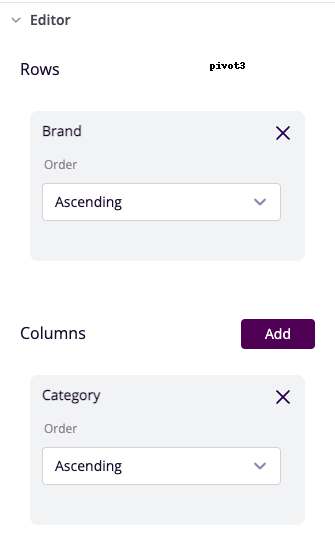
Row and Column Setup
- Rows: Select vertical organization field
- Row Order: Choose sorting criteria
- Columns: Select horizontal organization field
- Column Order: Set arrangement preference
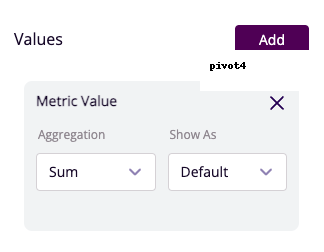
Value Configuration
- Values: Choose metrics to display
- Aggregation: Select calculation method
- Format: Set number formatting
Advanced Features
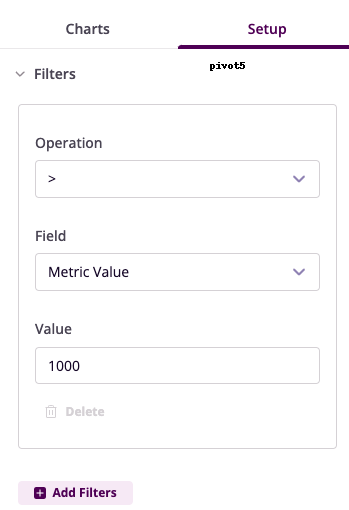
Filter Configuration
- Operation: Choose conditional operator
- Field: Select column to filter
- Value: Set filter criteria
- Operator: Combine multiple filters
Example Use Cases
Sales Performance Analysis
- Rows: Region
- Columns: Product Category
- Values: Sales (Sum)
- Filters: Region = "North America"
- Insight: Regional performance tracking
Customer Engagement Tracking
- Rows: Marketing Channel
- Columns: Campaign Name
- Values: Clicks (Count)
- Filters: Campaign Status = "Active"
- Insight: Channel effectiveness measurement